Hardwood Stocking Charts


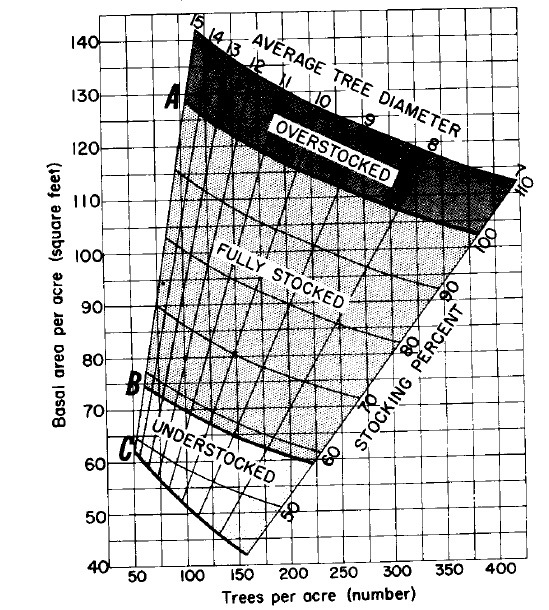
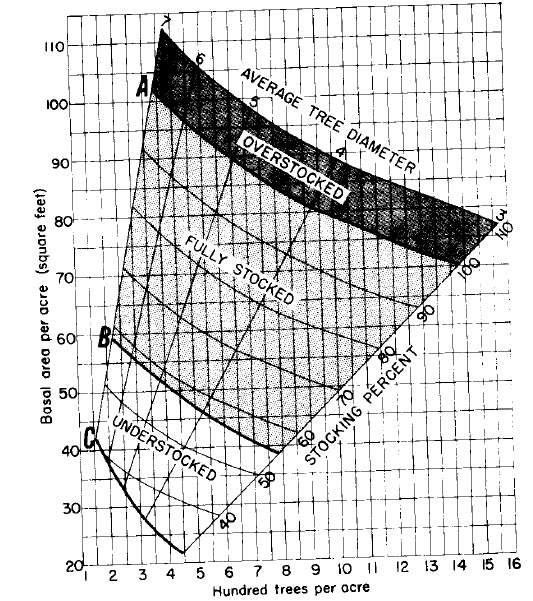
Relation of basal area, number of trees, and average tree diameter to stocking percent for upland
central hardwoods. Tree-diameter range 7-15 (left), 3-7 (right). The area between curves A and B
indicates the range of stocking where trees can fully utilize the site. Curve C shows the lower
limit of stocking necessary to reach the B level in 10 years on average sites. (Average tree
diameter is the diameter of the tree of average basal area.)
Procedure for Using Hardwood Stocking Charts
- Use Prism to determine basal area on 5 to 10 sample points (or more if conditions are not uniform).
- Ate each sample point, count all trees 2 inches DBH and over- using 1/20th acre plot (26 1/3 ft. radius).
- Then, knowing the B.A. and the number of trees per acre, read the “average tree diameter” and the “stocking percent” directly from the charts.
- Next, follow down the line of “Average Tree Diameter” (parallel to the nearest LOWER average diameter line) to line B; then follow the horizontal line from this point to find what the basal area should be for the stand (at intersection with B.A. Axis).
Example
For a stand with B.A. of 90 and 220 trees per acre, the average DBH is about 8.7 inches and the stand is 81% stocked. The B-level B.A. is 65 and the C-level is 51.
if the B.A. of the stand exceeds C-level requirements, the stand is worth managing. If worth managing, deduct B-level B.A. from the total B.A. to find the sq.ft. that may be cut (25 sq. ft. for this stand). Let stand grow up to 85%-90% stocking, and thin
again to near the B-level.
Foresters Field Handbook, North Carolina Forest Service, (Agriculture Handbook 355 Forest Service)